Can a simple breath test help save a life during CPR? A 2023 study published in JAMA Network Open found a strong link between rising levels of end-tidal carbon dioxide (EtCO₂) and better outcomes during resuscitation. Specifically, higher EtCO₂ levels were associated with a greater chance of return of spontaneous circulation (ROSC) in out-of-hospital cardiac arrest cases. This is where waveform capnography becomes important. It tracks how much CO₂ a person breathes out and shows it as a wave on a screen, helping doctors see how well the body is responding.
Still, many people don’t fully understand what waveform capnography does. Some think it’s just another monitor, but it’s actually a powerful tool used in emergencies, surgeries, and intensive care (ICU). It gives real-time updates about breathing and can guide life-saving decisions. So, read on to learn how waveform capnography works and why it’s more than just numbers on a screen.
Master ACLS Now
Get ACLS certified with confidence
What Is Quantitative Waveform Capnography?
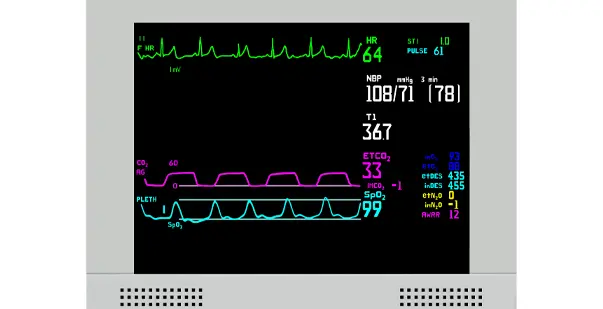
Quantitative waveform capnography is a device that measures the amount of carbon dioxide (CO₂) a person breathes out. It provides two important things: a number that indicates the amount of CO2 present (called ETCO₂) and a waveform (graph) that shows how CO2 levels change during each breath.
This tool uses a sensor placed near the airway, either on a face mask or a breathing tube. As the person breathes, the sensor detects CO₂ levels in real-time. The information is shown on a screen as a moving graph, called a capnogram. Quantitative waveform shows each phase of breathing and helps detect problems with breathing, airway blockages, or poor blood circulation. It allows doctors and nurses to respond quickly if something goes wrong with the lungs or heart.
What Are ETCO₂ and PETCO₂?
When using quantitative waveform capnography during ACLS training, two key terms often arise: ETCO₂ and PETCO₂. Both relate to the amount of carbon dioxide (CO₂) a person breathes out, especially at the end of exhalation.
ETCO₂ (End-Tidal Carbon Dioxide)
In ACLS, ETCO₂ stands for End-Tidal Carbon Dioxide. It’s a measurement of how much carbon dioxide (CO₂) is in the air that a person breathes out at the very end of each breath. This is done using a tool called capnography, which gives a number showing how well someone is breathing and how well their blood is circulating.
Normal Range
The normal ETCO₂ range is 35 to 45 mmHg (millimeters of mercury). This range tells us that the lungs are working properly, breathing out enough carbon dioxide, and that the heart is pumping blood well.
What It Tells You
ETCO₂ levels give important clues:
- Low ETCO₂ (below 35 mmHg): May mean hyperventilation (breathing too fast) or poor blood flow, which is often seen during cardiac arrest.
- High ETCO₂ (above 45 mmHg): Could mean hypoventilation (not breathing enough), where CO₂ is building up in the body.
Why It Matters in ACLS
In ACLS, ETCO₂ is a key part of patient care. One of its most important uses is to confirm the correct placement of an endotracheal (breathing) tube. If the tube is in the right place, there will be a clear and steady ETCO₂ reading. If not, the number will be extremely low or flat, which can help medical providers quickly correct the problem.
PETCO₂ (Partial Pressure of End-Tidal CO₂)
PETCO₂ stands for Partial Pressure of End-Tidal Carbon Dioxide. It measures the amount of carbon dioxide (CO₂) in the air exhaled at the very end of a breath. Although it uses the term “partial pressure,” it refers to the same value as ETCO₂, and both are often used interchangeably, especially during medical care like ACLS.
Normal Range
The normal PETCO₂ range is 35 to 45 mmHg, just like ETCO₂. This range shows that the person is breathing properly and that their circulation is functioning well.
What It Tells You
PETCO₂ gives a real-time view of a person’s ventilation status, how well they are exhaling carbon dioxide. Since CO₂ is carried in the blood to the lungs, PETCO₂ also gives clues about blood flow and overall heart function. If the number is too low or too high, it may point to problems with breathing, blood circulation, or both.
Why It Matters in ACLS
In ACLS, PETCO₂ monitoring plays a vital role, especially during critical care situations. It helps confirm whether a breathing tube is correctly placed in the airway. During CPR, PETCO₂ levels reflect the quality of chest compressions and overall blood flow. A sudden increase in PETCO₂ during resuscitation can be one of the first signs that the heart has started beating again, a condition known as Return of Spontaneous Circulation (ROSC). This makes PETCO₂ a valuable tool for guiding emergency care.
What Are Waveform Capnography Devices?
Waveform capnography devices measure the amount of carbon dioxide (CO₂) a person exhales. They show this in two ways: a number (ETCO₂) and a graph, called a capnogram, that displays CO₂ levels with each breath. These devices help doctors and emergency workers track a patient’s breathing in real-time.
There are two main types of devices:
- Hospital Machines: These are larger and used in areas such as the operating room, ICU, and emergency department. They give highly accurate readings.
- Portable Devices: These are smaller, easy to carry, and often used in ambulances or by paramedics during emergencies.
All capnography devices use a sensor placed near the patient’s nose or mouth. This sensor detects CO₂ in the exhaled air and sends the data to the screen. There are also two systems:
- Mainstream Capnography: The sensor is placed directly in the breathing circuit, usually between the breathing tube and ventilator. It gives fast and accurate CO₂ readings and is commonly used during surgeries or when using ventilators.
- Sidestream Capnography: A small tube pulls a sample of the exhaled breath into the main unit for analysis. It is easier to set up and is often used in emergency care or recovery rooms.
Mainstream capnography showed a mean bias of only 2.7 mmHg (± limits −1.6 to +7.0 mmHg) compared to PaCO₂. The sidestream method had a significantly larger bias of 6.2 mmHg. It also offers more consistent readings, especially in critical care settings.
Read More: Why Assessing the Situation During Emergencies is Essential?
How Is Quantitative Waveform Capnography Applied in Different Situations?
Quantitative waveform capnography is helpful during CPR and surgery, as it shows how well a patient is breathing. The use of waveform capnography during intubation significantly increased between 2010 and 2015, rising from 39% to 53%. This shows that capnography is widely used in critical care settings. Here are some common examples where capnography is used:
-
During CPR
Quantitative waveform capnography helps during CPR by showing the effectiveness of chest compressions. A low or flat waveform means poor blood flow or ineffective compressions. A sudden rise in end-tidal CO₂ (ETCO₂) can suggest return of spontaneous circulation (ROSC). This real-time feedback helps rescuers adjust their actions to improve the patient’s chances of survival.
-
In the Operating Room
In surgeries, capnography is used to monitor a patient’s ventilation while under anesthesia. It confirms correct endotracheal tube placement and ensures the lungs are exchanging gases properly. A normal waveform indicates that the patient is breathing well, while sudden changes may alert doctors to problems such as hypoventilation, airway obstruction, or equipment disconnection.
-
For Sedation and Pain Relief
Some medications used for sedation or pain relief can slow down breathing. Quantitative waveform capnography provides early warning by detecting shallow or paused breaths. A study published in BMJ Open shows that using capnography during sedation reduces the risk of respiratory complications by up to 31%. A drop in ETCO₂ or a change in the waveform shape alerts medical staff, allowing them to take quick action before oxygen levels fall and preventing respiratory depression or arrest.
-
In the ICU or Emergency Room
Patients in critical care often need close monitoring of their breathing. Capnography helps track how well their lungs are working. High ETCO₂ can signal hypoventilation, while low levels may suggest hyperventilation or shock. It’s especially helpful for patients with asthma, COPD (chronic obstructive pulmonary disease), or airway obstructions, providing quick and non-invasive data to guide treatment.
-
For People on Ventilators
Ventilators support patients who are unable to breathe on their own. Capnography continuously measures exhaled CO₂ and ensures ventilator settings are correct. A steady waveform with normal ETCO₂ shows good ventilation. If the waveform changes or the numbers drop, it may indicate poor lung function, a blockage, or a problem with the ventilator.
Read More: How to Manage a Respiratory Arrest?
How to Interpret Capnography Waveforms?
Doctors and nurses can quickly understand how well your lungs are working by studying capnography waveforms. In fact, capnography can detect breathing problems up to 2 minutes before oxygen levels drop. The interpretations of capnography waveforms are:
Phase I: Baseline- No CO2 Yet
Phase I is the flat line at the start of exhalation. It shows that no carbon dioxide (CO₂) is present yet. This air comes from the trachea and large airways, where there is no gas exchange. In quantitative capnography, this flat line confirms the monitor is working correctly.
Phase II: Ascending Limb- CO2 Appears
Phase II rises sharply as CO₂-rich air begins to exit the lungs. This part shows the transition from CO₂-free air to air from the alveoli. A steep upward slope indicates proper ventilation. In capnography, changes in this phase may suggest partial airway obstruction or difficulty exhaling.
Phase III: Alveolar Plateau – Measuring True Ventilation
Phase III is more level and represents alveolar gas, the CO₂ coming from deep in the lungs. A slightly upward slope is normal. A steep slope might suggest uneven gas exchange, often seen in asthma or chronic obstructive pulmonary disease (COPD). This phase helps calculate the ETCO₂ value accurately.
Return to Baseline – Inhalation Begins
After exhalation ends, the waveform drops sharply back to baseline as the patient inhales fresh air with little or no CO₂. This quick return to zero suggests normal inhalation and a clear airway.
Use Quantitative Waveform Capnography Effectively in Patient Care!
Quantitative waveform capnography is a powerful tool that helps doctors and nurses see how well a person is breathing. It shows ETCO₂ and a capnogram that help detect problems such as poor ventilation, airway blockage, or low blood flow. Capnography gives real-time information that can help save lives during CPR, surgery, sedation, or while using a ventilator. Healthcare providers can act more quickly and make better decisions by understanding waveforms and ETCO2 levels. It’s an important part of patient care in emergency and critical situations.
If you want to learn how to use capnography in real emergencies, Advanced Cardiovascular Life Support (ACLS) training is a great next step. Sign up today and get the skills to respond with confidence when every second matters.